Exercise 3.1: Decision Tree Classification
¶Predict the risk class of a car driver based on the following attributes:
- Time since getting the driving license (1 - 2 years, 2 - 7 years, > 7 years)
- Gender (male, female)
- Residential area (urban, rural)
The training set is given below:
| Person | Time Since licence | Gender | Area | Risk class |
|---|---|---|---|---|
| 1 | 1 - 2 | m | urban | low |
| 2 | 2 - 7 | m | rural | high |
| 3 | > 7 | f | rural | low |
| 4 | 1 - 2 | f | rural | high |
| 5 | > 7 | m | rural | high |
| 6 | 1 - 2 | m | rural | high |
| 7 | 2 - 7 | f | urban | low |
| 8 | 2- 7 | m | urban | low |
(a)Building the classifier:
¶Construct a decision tree based on this training data.
For splitting, use information gain as measure for impurity. Build a separate branch for each attribute value.
The decision tree shall stop when all instances in the branch have the same class or no further attribute for splitting is available.
Decision Tree Recap
¶$\rightarrow$ Use Information gain to determine which attribute is most useful
$\mapsto$ Information gain, gain ratio, gini index, ... as a measure of inpurity
$\mapsto$ The resulting partition is as pure a possible
All based on the degree of impurity of the parent node vs the children node
Entropy, a measure of impurity
¶Given a collection S, containing positive and negative example of the target class, the entropy of the S is $$Entropy(S) = -p_\oplus log_2(p_\oplus) - p_\ominus* log_2(p_\ominus)$$
$p_\oplus$ is proportion of positive examples of S
$p_\ominus$ : proportion of positive examples of S
Entropy of the Target Class in the Training Data
¶| Person | Time Since licence | Gender | Area | Risk class |
|---|---|---|---|---|
| 1 | 1 - 2 | m | urban | low |
| 2 | 2 - 7 | m | rural | high |
| 3 | > 7 | f | rural | low |
| 4 | 1 - 2 | f | rural | high |
| 5 | > 7 | m | rural | high |
| 6 | 1 - 2 | m | rural | high |
| 7 | 2 - 7 | f | urban | low |
| 8 | 2- 7 | m | urban | low |
S = [4+, 4-]
$p_\oplus = \frac{4}{8} = 0.5$
$p_\ominus = \frac{4}{8} = 0.5$
$Entropy\left(S\right) = Entropy\left([4+, 4-]\right)= -0.5 * log_2\left(0.5\right) - 0.5 * log_2(0.5) = 1 $
Information Gain, the Expected Reduction in Entropy
¶$$Gain(S, A) = Entropy(S) -\sum_{v \in Values(A) }\frac{|S_v|}{|S|}Entropy(S)$$
$Values(A) $ is the selt of all posible value for the attribute A (class attribute)
$S_v$ is the subset of S for which attribute A has the value $v$ (i.e. $Sv = {s \in S\mid A(s) = v}$)
Information Gain for the ` Time since licence `
¶| Person | Time Since licence | Gender | Area | Risk class |
|---|---|---|---|---|
| 1 | 1 - 2 | m | urban | low |
| 2 | 2 - 7 | m | rural | high |
| 3 | > 7 | f | rural | low |
| 4 | 1 - 2 | f | rural | high |
| 5 | > 7 | m | rural | high |
| 6 | 1 - 2 | m | rural | high |
| 7 | 2 - 7 | f | urban | low |
| 8 | 2- 7 | m | urban | low |
| Values(A) | $S_v$ | Entropy($S_v)$ | $\frac{\mid S_v\mid }{\mid S\mid}$ | $\frac{\mid S_v\mid}{\mid S\mid}Entropy(S_v)$ |
|---|---|---|---|---|
| 1 - 2 | 2+, 1- | 0.918 | 3/8 | 0.34436093777043358 |
| 2 - 7 | 1+, 2- | 0.918 | 3/8 | 0.34436093777043358 |
| > 7 | 1+, 1- | 1 | 3/8 | 0.25 |
$Gain\left(S, A\right) = 1 - \left(0.3443609378 + 0.3443609378 + 0.25 \right) = 0.06127$
Information Gain for the ` Gender `
¶| Person | Time Since licence | Gender | Area | Risk class |
|---|---|---|---|---|
| 1 | 1 - 2 | m | urban | low |
| 2 | 2 - 7 | m | rural | high |
| 3 | > 7 | f | rural | low |
| 4 | 1 - 2 | f | rural | high |
| 5 | > 7 | m | rural | high |
| 6 | 1 - 2 | m | rural | high |
| 7 | 2 - 7 | f | urban | low |
| 8 | 2- 7 | m | urban | low |
| Values(A) | $S_v$ | Entropy($S_v)$ | $\frac{\mid S_v\mid }{\mid S\mid}$ | $\frac{\mid S_v\mid}{\mid S\mid}Entropy(S_v)$ |
|---|---|---|---|---|
| m | 3+, 2- | 0.971 | 5/8 | 0.6068 |
| f | 1+, 2- | 0.918 | 3/8 | 0.3443 |
$Gain\left(Risk Class, Gender\right) = 1 - \left(0.6068+ 0.3443\right) = 0.0488$
e_sv1 = -3./5 * np.log2(3./5) - 2./5 *np.log2(2./5 )
e_sv2 = -1./3 * np.log2(1./3) - 2./3 *np.log2(2./3)
gain = 1 - (5./8 *e_sv1 + 3./8 * e_sv2)
print (gain)
Information Gain for the ` Area`
¶| Person | Time Since licence | Gender | Area | Risk class |
|---|---|---|---|---|
| 1 | 1 - 2 | m | urban | low |
| 2 | 2 - 7 | m | rural | high |
| 3 | > 7 | f | rural | low |
| 4 | 1 - 2 | f | rural | high |
| 5 | > 7 | m | rural | high |
| 6 | 1 - 2 | m | rural | high |
| 7 | 2 - 7 | f | urban | low |
| 8 | 2- 7 | m | urban | low |
| Values(A) | $S_v$ | Entropy($S_v)$ | $\frac{\mid S_v\mid }{\mid S\mid}$ |
|---|---|---|---|
| urban | 0+, 3- | 0 | 3/8 |
| rural | 4+, 1- | 0.722 | 5/8 |
$Gain\left(Risk Class, Area\right) = 1 - \left(0 + 0.722*5/8\right) = 0.5488$
Area is the Root Node
¶$Gain\left(Risk Class, Area\right)= 0.5488$
$Gain\left(Risk Class, Time since licence\right)= 0.06127$
$Gain\left(Risk Class, Gender\right)= 0.0488$
Area attribute has the highest information gain compared to other attributes
         area
        /    \
urban? /      \ rural?
      /        \
     /          \
 entropy = 0     entropy = -1./5 * log2(1./5) - 4./5 *log2(4./5) = 0.722
 low
We only have to create branches below the root node where the area = rural
Info Gain for the ` Time since licence, area=rural`
¶| Person | Time Since licence | Gender | Area | Risk class |
|---|---|---|---|---|
| 2 | 2 - 7 | m | rural | high |
| 3 | > 7 | f | rural | low |
| 4 | 1 - 2 | f | rural | high |
| 5 | > 7 | m | rural | high |
| 6 | 1 - 2 | m | rural | high |
| Values(A) | $S_v$ | Entropy($S_v)$ | $\frac{\mid S_v\mid }{\mid S\mid}$ |
|---|---|---|---|
| 1 - 2 | 2+, 0- | 0 | 2/5 |
| 2 - 7 | 1+, 0- | 0 | 1/5 |
| > 7 | 1+, 1- | 1 | 2/5 |
$Gain\left(S, Time since licence\right) = 0.722 - \left(0+ 0 + 2/5\right) = 0.322$
Information Gain for the ` Gender` Having Area=Rural
¶| Person | Time Since licence | Gender | Area | Risk class |
|---|---|---|---|---|
| 2 | 2 - 7 | m | rural | high |
| 3 | > 7 | f | rural | low |
| 4 | 1 - 2 | f | rural | high |
| 5 | > 7 | m | rural | high |
| 6 | 1 - 2 | m | rural | high |
| Values(A) | $S_v$ | Entropy($S_v)$ | $\frac{\mid S_v\mid }{\mid S\mid}$ |
|---|---|---|---|
| m | 3+, 0- | 0 | 3/5 |
| f | 1+, 1- | 1 | 2/5 |
$Gain\left(S, Gender\right) = 0.722 - 0.4 = 0.322$
Second Split Decision
¶There is a tie between the gender and time since licence. Lets break the tie by arbitrary choosing the Gender
The tree at the second split become
                 area
                /    \
        urban? /      \ rural?
              /        \
             /          \
            /            \
         low             gender
                         /      \
                        /        \
                       m          f
                      /            \
                     /              \
           entropy= 0                 entropy = 1
Notice that we do not have to branch when the gender is male and area is rural.
We could have broken the tie by splitting with Time since licence and the tree would have been different.
3rd Split
¶ area
/ \
urban? / \ rural?
/ \
/ \
/ \
low gender
/ \
/ \
m f
/ \
/ \
high entropy = 1
| Person | Time Since licence | Gender | Area | Risk class |
|---|---|---|---|---|
| 3 | > 7 | f | rural | low |
| 4 | 1 - 2 | f | rural | high |
| Values(A) | $S_v$ | Entropy($S_v)$ | $\frac{\mid S_v\mid }{\mid S\mid}$ |
|---|---|---|---|
| > 7 | 0+, 1- | 0 | 1/2 |
| 1- 2 | 1+, 0- | 0 | 1/2 |
$Gain\left(S, Time Since Licence\right) = 1 - 0 = 1$
Final Tree
¶ area
/ \
urban? / \ rural?
/ \
/ \
low gender
/ \
/ \
m f
/ \
/ \
high time since licence
/ \
/ \
>7 1-2
/ \
/ \
low high
The results are different if you chose time since licence over gender at the second split
(B) Classification
¶Person A:
- Time since licence : 1-2
- Gender : f
- Area: rural
- Risk class: high
Person B:
- Time since licence : 2-7
- Gender : m
- Area: urban
- Risk class: low
Person C:
- Time since licence : 1-2
- Gender : f
- Area: urban
- Risk class: low
References
¶- T. M. Mitchell, "Decision Tree Learning", in Machine Learning, McGraw-Hill, Inc., New York, NY, 1997 p. 52-60
- M. Renz, Lecture 5: Classification, CDS 303 Scientific Data Mining
Exercise 3.2: Evaluation of Classifier
¶Given a da ta set with known class labels of the objects (column Object class in tables below). In order to evaluate the quality of a classifier K, each object is classified using K (column K(o)). The results are given in the table (all three columns) below
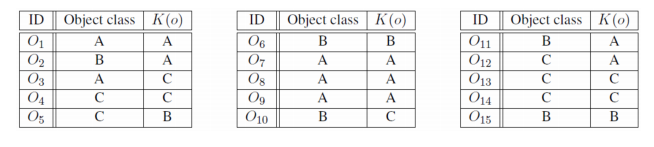
Using the table (all three columns) above, compute:
- accuracy:
- error rate
- precision
- recall, and
- F1-measure for each class.
Confusion Matrix for Each Class
¶| Class | A | B | C |
|---|---|---|---|
| A | 4 | 0 | 1 |
| B | 2 | 2 | 1 |
| C | 1 | 1 | 3 |
| Class | True Positive | True Negative | False Positive | False Negative | Accuracy | Error Rate | Precision | Recall | F1-measure |
|---|---|---|---|---|---|---|---|---|---|
| A | 4 | 7 | 3 | 1 | |||||
| B | 2 | 9 | 1 | 3 | |||||
| C | 3 | 8 | 2 | 2 |
TP: A that were classified as A
TN: B or C that were classified as B or C (not A)
FP: B or C that were classified as A
FN: A that were classified as B or C (not A)
| A | B or C | |
|---|---|---|
| A | 4 | 1 |
| B or C | 3 | 7 |
Accuracy
¶$$Accuracy = \frac{TP + TN}{P + N}$$P + N = 15
| Class | True Positive | True Negative | False Positive | False Negative | Accuracy |
|---|---|---|---|---|---|
| A | 4 | 7 | 3 | 1 | 0.733 |
| B | 2 | 9 | 1 | 3 | 0.733 |
| C | 3 | 8 | 2 | 2 | 0.733 |
Error Rate
¶$$Error Rate= \frac{FP + FN}{P + N}$$P + N = 15
| Class | True Positive | True Negative | False Positive | False Negative | Accuracy | Error Rate |
|---|---|---|---|---|---|---|
| A | 4 | 7 | 3 | 1 | 0.733 | 0.267 |
| B | 2 | 9 | 1 | 3 | 0.733 | 0.267 |
| C | 3 | 8 | 2 | 2 | 0.733 | 0.267 |
Precision and Recall
¶$$Precision = \frac{TP}{TP + FP}$$$Precision (A) = \frac{4}{4+3} = 0.571$
$Recall (A) = \frac{4}{4+1} = 0.8$
| Class | True Positive | True Negative | False Positive | False Negative | Accuracy | Error Rate | Precision | Recall |
|---|---|---|---|---|---|---|---|---|
| A | 4 | 7 | 3 | 1 | 0.733 | 0.267 | 0.571 | 0.8 |
| B | 2 | 9 | 1 | 3 | 0.733 | 0.267 | 0.667 | 0.4 |
| C | 3 | 8 | 2 | 2 | 0.733 | 0.267 | 0.600 | 0.6 |
Recall in this context is also referred to as the true positive rate or sensitivity, and precision is also referred to as positive predictive value (PPV);
F1 measure
¶$$F_1 measure = \frac{2* Precision * recall}{Precision + recall}$$$F_1 measure (A) = \frac{2* 0.571 * 0.8}{0.571 + 0.8} = 0.667$
| Class | True Positive | True Negative | False Positive | False Negative | Accuracy | Error Rate | Precision | Recall | F1-measure |
|---|---|---|---|---|---|---|---|---|---|
| A | 4 | 7 | 3 | 1 | 0.733 | 0.267 | 0.571 | 0.8 | 0.667 |
| B | 2 | 9 | 1 | 3 | 0.733 | 0.267 | 0.667 | 0.4 | 0.5 |
| C | 3 | 8 | 2 | 2 | 0.733 | 0.267 | 0.600 | 0.6 | 0.6 |
Exercise 3.3: k-NN Classification
¶The 2D feature vectors in the figure below belong to two different classes (circles and rectangles).
Classify the object at (6; 6) — in the image represented using a triangle — using k nearest neighbor classification (k = 4, k =7 and k = 10).
Use Manhattan distance (L1 norm) as distance function, and use the non-weighted class counts in the k-nearest neighbor set, i.e. the object is assigned to the majority class within the k nearest neighbors
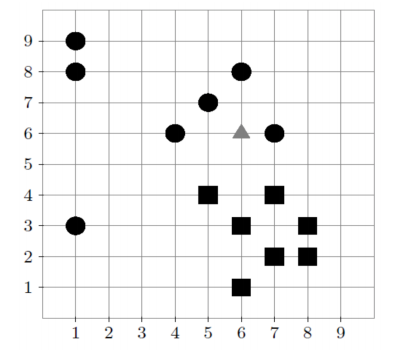
B) Using the weighted class votes using $w=1/d^2$
¶The 2D feature vectors in the figure below belong to two different classes (circles and rectangles).
Classify the object at (6; 6) — in the image represented using a triangle — using k nearest neighbor classification (k = 4, k =7 and k = 10).
Use Manhattan distance (L1 norm) as distance function, and the weighted class votes using $w=1/d^2$ as weight factor for each vote.
B) k = 4, Using the Weight $w=1/d^2$
¶There is one circle at d = 1, and 3 circles at d = 2.
The weight of the circles is $w= 1 + 3* \frac{1}{4} = 1.75$
We classify the image as a circle
B) K = 7, Using the Weight $w=1/d^2$
¶- There is one circle at d = 1, and 3 circles at d = 2.
- There are three rectangles at d = 3.
The weight of the circles is $w= 1 + 3* \frac{1}{4} = 1.75$
The weight of the circles is $w= 3* \frac{1}{3^2} = 0.333$
We classify the image as a circle
B) k = 10, Using the Weight $w=1/d^2$
¶- There is one circle at d = 1, and 3 circles at d = 2.
- There are three rectangles at d = 3 and three rectangle at d = 5
The weight of the circles is $w= 1 + 3* \frac{1}{4} = 1.75$
The weight of the circles is $w= 3* \frac{1}{3^2} + 3* \frac{1}{5^2}= 0.453$
We classify the image as a circle
Comparing the Two Schemas
¶| Non-weighted class counts | Weighted class votes using, $w=1/d^2$ | |
|---|---|---|
| k=4 | circle | circle |
| k=7 | circle | circle |
| k = 10 | rectangle | circle |